|
In
April, news outlets across the world announced the first successful
attempt to capture the image of a black hole, accomplished by the Event
Horizon Telescope (EHT) consortium, which comprises over 207 scientists
from 36 universities and scientific institutes (by my count).
Recently, EHT published six research papers describing this feat. This newsletter explores the highlights of those papers.
EHT
confirmed Einstein’s theory of general relativity in several
exceptional regards. They achieved the most precise measurement ever
made of the size of a black hole, and validated general relativity in a
record-high gravitational field — about one billion g (1 g = Earth’s surface gravity).
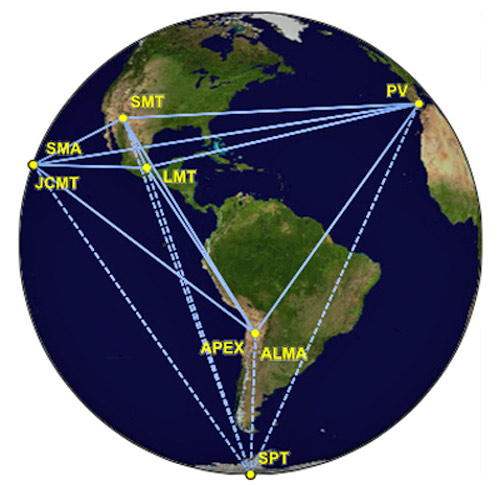
To
accomplish this feat, EHT built an array of 8 radio telescopes spanning
half Earth’s surface, as shown here. Two telescopes are in Hawaii, two
in Chile, one in Arizona, one in Mexico, one in Spain, and one near the
South Pole. Using interferometry, this array achieves sufficient
resolution — about 10 micro-arcseconds — to read 10-point type from 50,000 miles away.
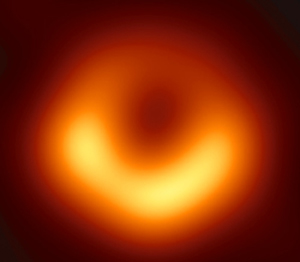 On
four nights in April 2017, EHT targeted M87*, the black hole at the
center of galaxy M87, 55 million light-years away. They spent two years
processing 15 million gigabytes of data to get this image. On
four nights in April 2017, EHT targeted M87*, the black hole at the
center of galaxy M87, 55 million light-years away. They spent two years
processing 15 million gigabytes of data to get this image.
The
black hole, hidden within its event horizon, is in the dark center of
the yellow/orange donut. In this image, color denotes temperature — the
brightest yellow corresponds to 11 billion ºF.
The “donut” is actually a photon ring
— light captured by the black hole’s gravity that spirals in
quasi-stable, nearly circular orbits. From their analysis, EHT
determined the photons at the donut’s bottom are moving toward us as
they orbit the black hole and therefore appear brighter than the photons
at the donut’s top, which are moving away from us.
EHT
analyzed radio waves of frequency 320 GHz (1.3 mm wavelength), because
light of that frequency easily penetrates the material surrounding a
black hole — a plasma of electrons and ionized gas.
Astronomers
typically minimize atmospheric interference by placing their telescopes
atop high mountains. EHT telescopes are at elevations ranging from
9,400 to 17,000 feet (2816 to 5105 m). EHT went further and collected
data only on clear, cold winter’s nights (as cold as –300ºF). In air
that thin, normal computer hard drives fail quickly, so EHT puts their
drives in pressurized, helium-filled containers.
If
EHT had one 7000-mile-wide radio telescope, obtaining this image would
be almost as easy as point-and-shoot. However, getting that resolution
from 8 telescopes spread across 7000 miles is much more complex — that’s
why it took two years.
Interferometry
relies on comparing the phases of radio waves arriving at each of the 8
telescopes. All the data from each telescope must be recorded and
precisely time-stamped. Computer hard drives full of data must be flown
from the telescope sites to two analysis centers that independently
process them (double checking one another). More about image processing
later.
From
their analysis, EHT measured the mass of black hole M87* to be 6.5
billion times the mass of our Sun, its gravitational radius Rg to be 10
billion km, and the photon ring radius to be 5.5Rg — all measured with
10% precision, and all consistent with general relativity.
With this image, general relativity has been validated over a range of masses spanning 15 orders of magnitude.
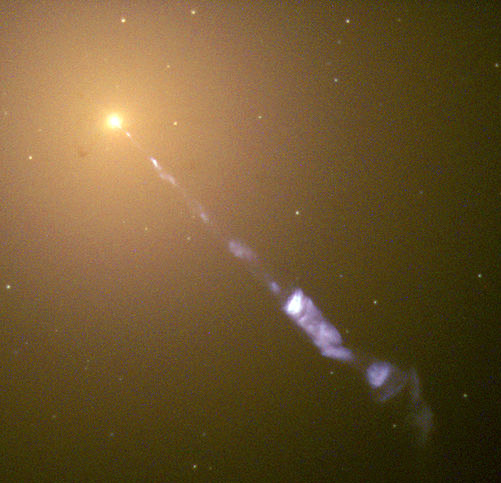 A
jet of charged particles shoots out along the rotational axis of M87*,
as seen in this Hubble Space Telescope image. When measured at radio
frequencies, this jet is 200,000 light-years along, about twice the
diameter of our Milky Way galaxy. A
jet of charged particles shoots out along the rotational axis of M87*,
as seen in this Hubble Space Telescope image. When measured at radio
frequencies, this jet is 200,000 light-years along, about twice the
diameter of our Milky Way galaxy.
EHT
will soon target Sag A*, the black hole at the center of our galaxy.
Sag A* is 27,000 light-years from us, and its mass is 4.1 million times
our Sun’s mass. Sag A* is 2000 times closer and 1600 times less massive
than M87*. Objects in the inner most stable orbit take days to orbit
M87* but only minutes to orbit Sag A*, which makes imaging Sag A*’s
rings more challenging. With some upgrades, EHT has a good shot at
making high precision measurements of Sag A*.
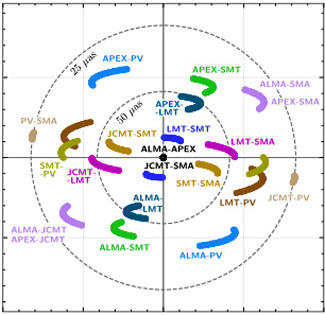 For
those interested in more technical details, interferometry produces a
frequency map (2D Fourier transform) of the target rather than a
conventional image. Here is EHT’s frequency map of M87A*. The data lie
in arcs due to Earth’s rotation during each night’s exposure. For
those interested in more technical details, interferometry produces a
frequency map (2D Fourier transform) of the target rather than a
conventional image. Here is EHT’s frequency map of M87A*. The data lie
in arcs due to Earth’s rotation during each night’s exposure.
If
the colored frequency data filled the entire outer circle, EHT could
easily reconstruct a perfect image. The art here is filling in the
blanks. Incidentally, this is the same problem I once faced doing
CT-scans on beating human hearts.

Best Regards,
Robert
October, 2019
Note: Previous newsletters can be found on my website.
|